How to use polska.fcst.pl and the fcst.pl app
Forecasts for gliding, paragliding, general aviation, sailing, mountains, ballooning, skiing and skydiving: on the website, in the phone app and in a widget for your aeroclub’s website.
The screenshots show the Polish version; the layout is the same in English (EN button on the website).
What’s new (October 2026)
XCSoar
- FCST forecast in XCSoar, free – today’s forecast files for Europe and 12 regions in the official XCSoar repository: thermals, cumulus base, wind and wave on the navigation map. More
Mobile app
- Gliding competitions from SoaringSpot – choose the contest, class and task, and the app works out the start window, the route in AAT areas and the conditions on the legs: Cu or blue, cirrus, bases, where to speed up and where to slow down. More
- Push notifications about good conditions – a bell on every profile card (gliding, paragliding, airplane, sailing) with your own thresholds; the server sends a notification after each forecast update. More
- Airplane (VFR) – My flight: weather along the route at the time you fly it, route cross-section, METAR and TAF, route import from SkyDemon, Garmin Pilot and ForeFlight. More
- Airfield map for glider pilots – about 4900 airfields across Europe (the forecast area) with their aeroclubs; forecast, alert and widget for your field. More
- Paragliding launch site map with a distance slider – all submitted sites, pick one with a pin. New: favourite sites on the card, coordinates and satellite imagery when adding a site, editing sites. More
- Sailing from your marina – marina list and map, submit new ones; the rating is for the marina, not the main location. More
- New profile: Mountain hiker – My hike. Put points on the map and the route follows the trails; the weather where you will be at each hour: wind chill, wind on the ridge, visibility, summits in cloud, thunderstorms. More
- New profile: Skydiving. Your drop zones with radius and jump altitude: a score for every hour, surface wind and gusts, winds aloft to the exit, cloud layers and the highest possible exit, temperature, thunderstorms and a spot estimate with the jump run – in the app and on the website. More
- New profile: Skiing. Ski areas and cross-country trails all over Europe: day score, conditions at the base, middle and top, a snow type hint, the official avalanche bulletin of the region and ski tours with the terrain slope along the route. More
- New profile: Balloon. Morning and evening flight windows with a score, wind and temperature every 100 m up to the inversion, fog and thunderstorms, and trajectories: where the wind takes you at each height. More
- Czech and French – the app now speaks Polish, English, German, Czech and French, notifications included.
- Invite a friend from Settings. More
- Home-screen widgets – “My places” with several places of all profiles and “FCST” for one place. Also the plain weather for cities (temperature, clouds, wind, rain). More
Website
- Rain radar – on the website (🌧️ button) and in the app – the Radar tab in the bottom menu (and the radar icon on today’s “Forecast map”): the EUMETNET OPERA composite every 10 minutes, animation of the last 2 hours. More
- Temperature aloft in wave mode – isotherms every 2 °C at the chosen level, the temperature at every level and the freezing level on a click; on the website and in the app. More
- Wave over the Alps on a 2 km grid – new area Alps – ICON-D2 (2 km, 48 h) in wave mode: French, Swiss, Austrian and Italian Alps, the Dolomites and Slovenia, today and tomorrow. More
- Forecast for all of Europe (about 34–55° N, 11° W–26° E) from the ECMWF model run through WRF on a ~5 km grid, up to 5 days ahead.
- Help in Czech – Nápověda česky.
1. Website – polska.fcst.pl
Main screen
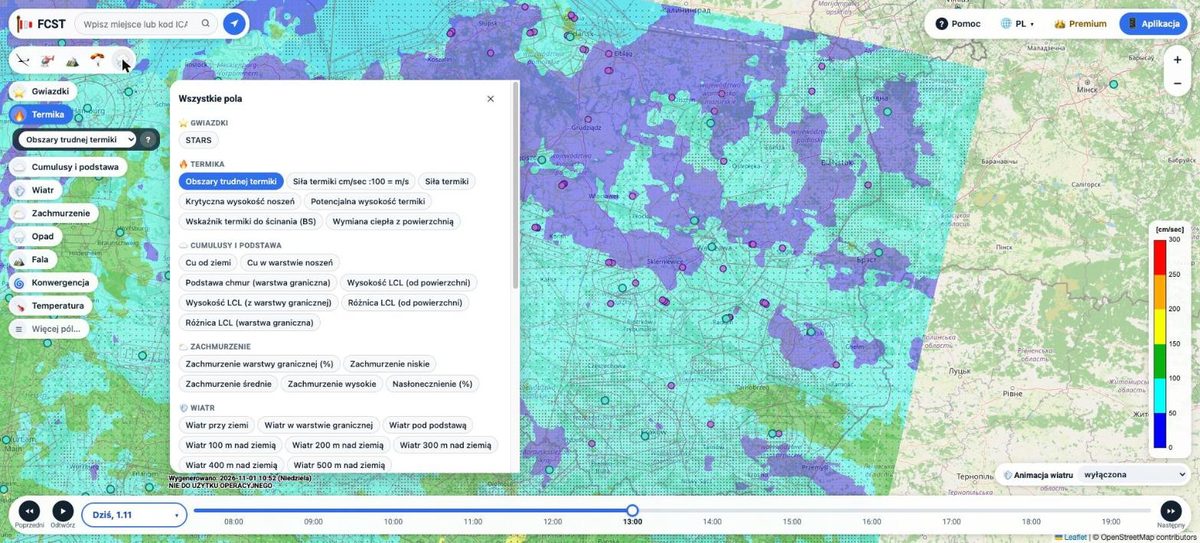
The website opens with a forecast map over Poland and a large part of Europe. You pan and zoom the map like any web map (mouse, wheel, or two fingers on a tablet).

| Element | What it does |
|---|---|
| Search Place or ICAO code… | Moves the map to a town or an airfield; the arrow button next to it – to your location. |
| Profile icons below the search | Gliding (gliding tools), GA aviation (VFR route), Wave, Skydiving, Rain radar. Each profile shows its own set of fields and tools. |
| Fields on the left (Stars, Thermals, Cumulus & base, Wind…) | What the map shows. Under the chosen field a list of its variants, ? – description of the field. More fields… opens all maps. |
| Bar at the bottom | Choice of the day (Today and later days), Previous / Next day, Play – animation of the hours, hour slider (local time). |
| Scale on the right | Meaning of the colours and the unit of the current field. |
| Wind animation (bottom right) | Moving wind streaks on the map: automatic (matched to the field), at a chosen height, or off. |
| Generated (above the bar) | When the model was computed – a new run appears every morning. |
| Help, language, Premium, App | This help page; website language (PL, EN, DE, CS, FR); later forecast days with the app’s Premium (details); download of the phone app. |
Dots and icons on the map are airfields and navigation aids, lines are airspace zones. Clicking an airfield, a zone or a METAR point shows details.
Forecast fields
The buttons on the left are groups of fields. Under the chosen button a list of its variants opens, e.g. for Thermals: areas of difficult thermals, thermal strength, critical and potential thermal height. More fields… opens all maps grouped by topic. The most used ones:
- Stars (STARS) – overall rating of thermal conditions (more stars = better).
- Areas of difficult thermals – thermal strength with dots where the wind “breaks” the thermals.
- Thermal strength – average climb in the thermal; scale in cm/s (100 cm/s = 1 m/s).
- Potential thermal height – up to what height the lift can be used.
- Cumulus & base – whether there will be cumulus and where the cloud base is.
- Wind – at the surface, in the boundary layer, below the cloud base and every 100 m above ground.
- Precipitation, Storms (CAPE), Convergence, Temperature – rain, thunderstorm risk, wind convergence zones and temperature.
- Wave – switches to wave mode (see below).
Not sure what a field means? Choose it and click ? – the Explanation window describes it in plain language.

Later days with Premium
The forecast for today is open to everyone, without signing in. Tomorrow and later days are shown in a browser linked to an FCST app with Premium. The Premium button (or choosing tomorrow in the day bar) shows a QR code: in the app open Settings → Link with the website and scan the code or type the 6 characters. Details: Website: today free, later days with the app’s Premium.

Gliding tools
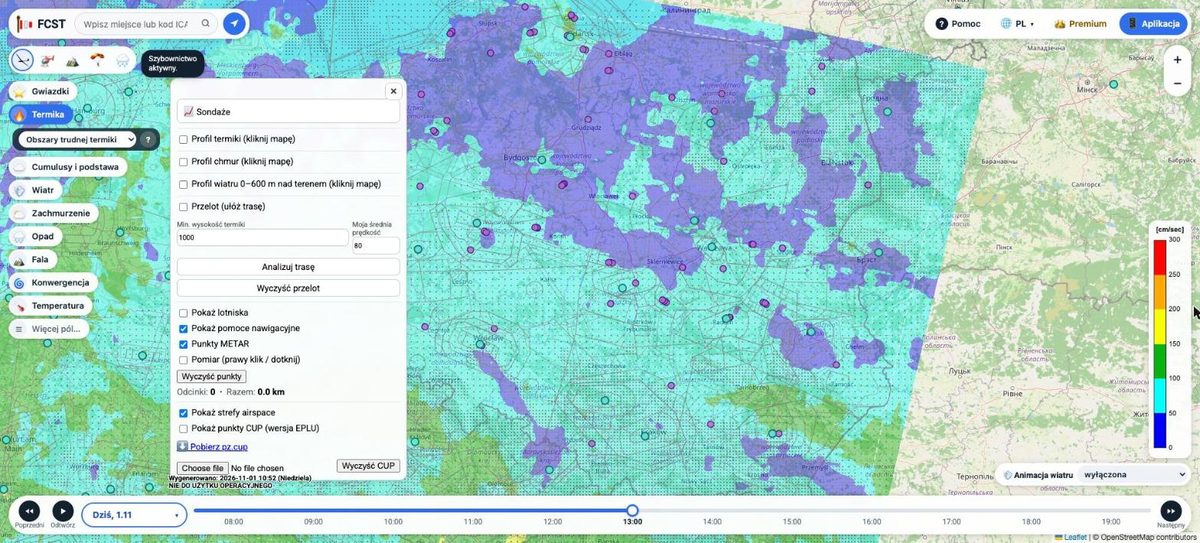
The glider icon among the profiles opens the tools menu:
- 📈 Soundings – aerological diagrams.
- Thermal profile, Cloud profile, Wind profile 0–600 m – tick one and click a place on the map; you get an hour-by-hour table for that point. The profiles need signing in (Apple ID or Google) – the sign-in window appears the first time.
- Cross-country – click the route points one after another, set the minimum thermal height and your average speed, then Analyze route. The result takes the current airspace use plan (PANSA AUP) into account.
- Show airfields, navigation aids, METAR points, airspace zones – map layers.
- Measure – right-click (tap on a tablet) adds points; you see the leg lengths and the total in km.
- CUP waypoints – show turnpoints (EPLU version), download
pz.cupor load your own file.


GA aviation – VFR route
The GA aviation profile icon opens the VFR route panel – the same route forecast as “My flight” in the app:
- Add points: click the map (with Map click adds a point ticked) or type an airfield (ICAO code) or a place. Points can be dragged, the arrow changes their order and Reverse swaps departure and destination.
- Set the day, the departure time, TAS [kt], your minima (ceiling above ground and visibility) and the cruise altitude.
- Click Calculate. The route on the map is coloured by VFR category (green – VFR, yellow – marginal, red – below minima), the panel shows a summary and warnings, and a route cross-section at the time over each point appears at the bottom: terrain, low, middle and high cloud, the 0 °C level, precipitation, wind and your cruise altitude. Hovering over the cross-section shows that place on the map.
The GA profile has its own set of fields (e.g. Cumulus & base, Cloud cover, Pressure, Storms CAPE). Today’s route is free, later days come with Premium (linking with the app). This is a planning tool, not an official briefing.

Wave
The wave icon among the profiles (or the Wave field) switches the map to wave mode. The panel on the right lets you choose:
- Area (tabs at the top of the panel):
- Europe (5 km grid) – wave over all mountain ranges covered by the forecast (Alps, Pyrenees, Apennines, Carpathians…), levels 1.5–6 km, hours 8–18. The 5 km grid shows large waves; short lee waves may be weaker or missing, so treat it as a guide.
- Poland 1.8 km – a detailed forecast for southern Poland (Sudetes, Carpathians): 5 days, 11 levels from 0.5 to 7 km.
- Alps 2 km – the ICON-D2 model of the German weather service (Deutscher Wetterdienst) over the French, Swiss, Austrian and Italian Alps, the Dolomites and Slovenia: levels 850/700/600/500/400 hPa (about 1.5–7 km), hours 8–18. Today and tomorrow only – for later days use the Europe area.
- Chile 1.8 km – a separate region of the site: the 🌍 button at the top switches from Europe to Chile – Andes. WRF 1.8 km over central Chile and the Andes (coast to Mendoza, about 30.8–36.2° S): all thermal, cloud base and wind layers, wave on 9 levels up to 300 hPa (about 9 km), today + 2 days, hours 8–18 Chile local time. In the app, places in this area (e.g. Vitacura, Santiago) get their forecast from this model.
- Day and hour or a time range (shows the maximum over the range).
- Level (AMSL) – each level with its height in km and pressure in hPa; All shows the strongest wave from all heights.
- Wave thresholds in cm/s – from which climb to draw an area and from which to count it as strong.
- Layers: wave contours, Sink instead of lift (areas where the air sinks – usually behind the lift band, downwind), wind animation and contours of low, middle and high cloud.
- Temperature – isotherms every 2 °C at the chosen level: the thick blue line is 0 °C, dashed blue lines are below freezing, red ones above. A click on the map shows the temperature at every level and the freezing level (for a range of hours, at its first hour). Useful when planning a wave flight: how cold it will be at height and from what altitude icing in cloud is possible.

Skydiving
The parachute icon among the profiles opens the Skydiving panel. Click the centre of the drop zone (landing target) on the map, set the radius, the jump altitude and the day. The panel shows the rating of the day, the best window and the hour table (ground wind and gusts, wind at exit altitude, max exit, visibility), and after clicking an hour – the sky column, the winds aloft and the spot on the map. The zones are saved in this browser (in the app you add them separately); the ratings are explained in the app chapter Skydiving.

Rain radar
The radar icon among the profiles turns on the rain radar. It shows the rain rate (mm/h) from the European EUMETNET OPERA radar composite: a new image every 10 minutes, a few minutes after the measurement, for the last 2 hours. The bar at the bottom: ▶ plays the animation, the slider picks a moment, next to it the time of the image and the colour scale. When the newest image is older than 30 minutes, the bar says so. Italy is not covered (not part of OPERA). Clicking the icon again returns to the forecast.

The website on a phone
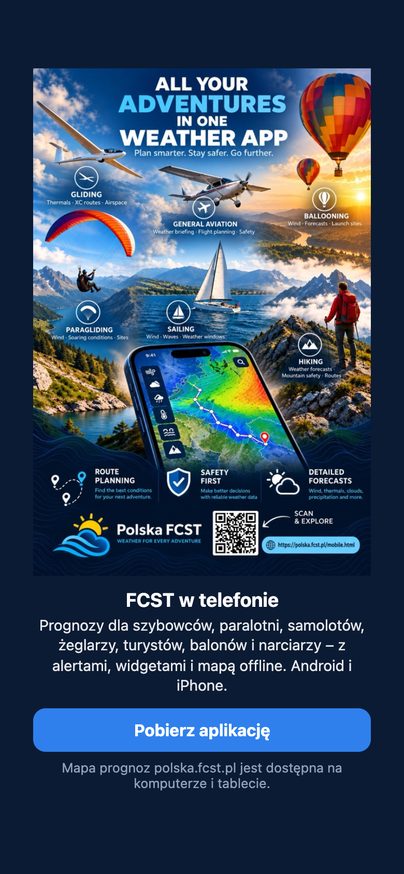
The polska.fcst.pl forecast map works on computers and tablets. On a phone the website invites you to the FCST app instead – it has ready-made day ratings for all profiles, alerts, offline maps and home-screen widgets.
2. The fcst.pl mobile app
The fcst.pl app (Android and iOS) turns the FCST forecast for a chosen place into ready-made day ratings from 0 to 100: 70 good conditions, 40 average, 10 poor. Tapping a day shows the hours, the reasons for the rating and the map.
Download: polska.fcst.pl/mobile.html – Android (Google Play) and iPhone.
First start
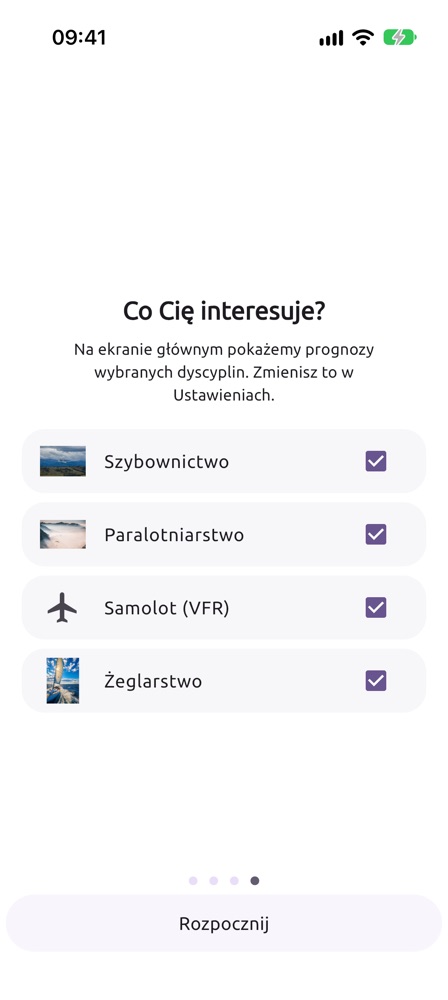
- Swipe through the welcome screens and tick the disciplines you are interested in: gliding, paragliding, airplane (VFR), sailing, mountain hiker, balloon, skiing and skydiving. You can also tick none – the app is then a regular, detailed weather forecast. Only their cards will appear on the main screen (you can change this later in Settings → Disciplines).
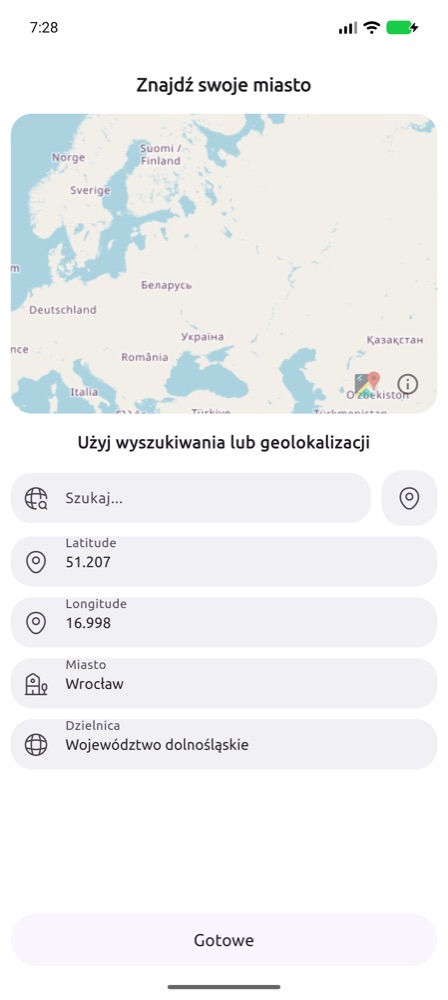
- Choose a location: type a city name in Search… or tap the pin icon to use GPS. Add more places in the Cities tab.
Free plan and Premium
| Free plan | Premium | |
|---|---|---|
| Regular weather forecast (Weather screen, cities) | no limits | no limits |
| Gliding (thermal, ridge, wave) | today, one location set permanently | all days (up to 7), any locations |
| Paragliding | one launch site set permanently, today; later days – warnings only | all days, any launch sites |
| VFR airplane (My flight) | today, departure from now up to 3 hours ahead | any hour on the forecast days |
| Mountain hiker (My hike) | departure today | up to 5 days ahead |
| Sailing (ratings and My voyage) | today; voyage departing within 3 hours | all days; voyage up to 5 days ahead |
| Balloon | today (rating and trajectories) | up to 5 days |
| Skiing | today and the avalanche danger level | all days, avalanche problems, alerts |
| Skydiving | today | all days |
| Rain radar | latest image | animation of the last 2 hours |
| Who’s going | all entries visible | own entries and photos |
| Warnings (thunderstorms, strong wind) | yes | yes |
| Widgets with discipline ratings | – (widgets with the regular weather – yes) | yes, up to 6 places |
| Good-conditions alerts | – | yes |
| Offline data and maps | – | yes |
| Gliding competitions (SoaringSpot) | task analysis for today | also on other forecast days |
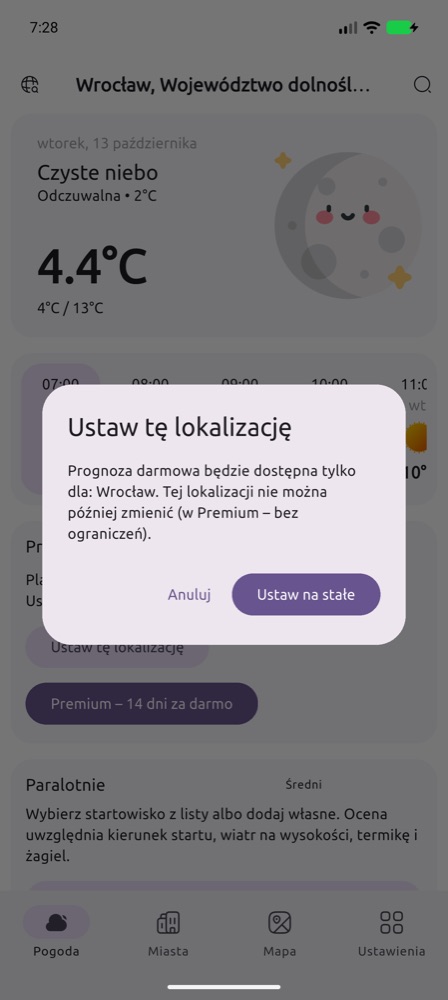
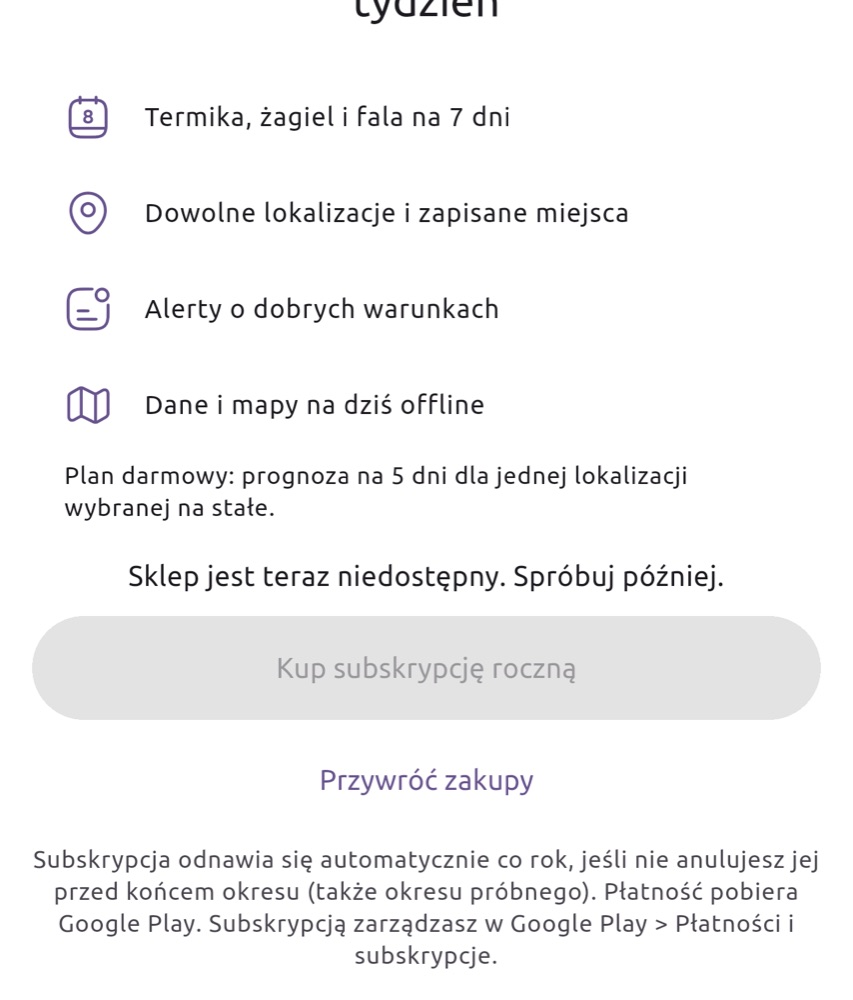
The free location (and the free launch site) cannot be changed later – choose the place you fly from most often. Premium can be tried free for 14 days; after that it is a yearly subscription that you manage in Google Play or in your Apple account settings. You can open the Premium screen at any time with the crown in the top bar of the Weather screen or in Settings → Premium.
Weather, Radar, Cities and Map
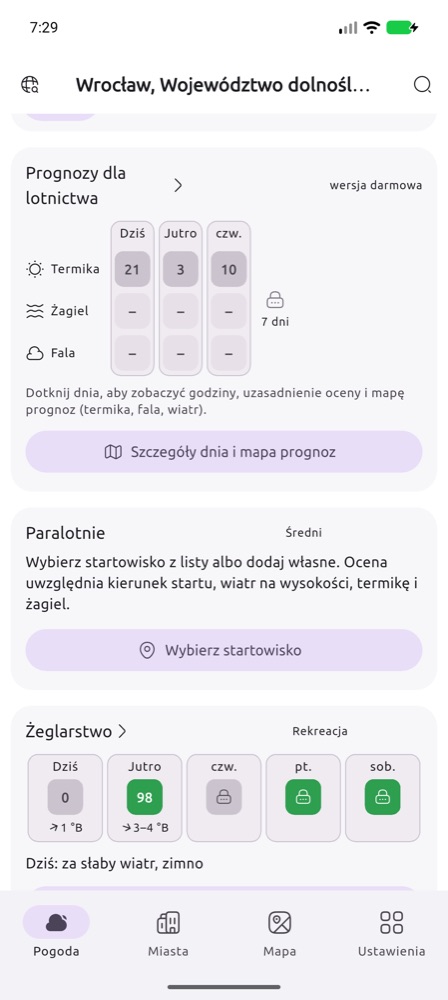
The bottom bar of the app has the tabs Weather, Radar, Cities, Map and Settings.
- Weather – the main screen: current conditions at the main location (icon, temperature and feels-like, wind, humidity, visibility), an hourly strip with day headers and a day-by-day forecast for up to 12 days; tap a day for its details. Below are the cards of the disciplines you chose. The weather icon follows the total cloud cover: sun, sun with a cloud, or clouds only when the sky is overcast.
- Radar – a precipitation map from the EUMETNET OPERA radar composite for all of Europe, refreshed every few minutes. Free plan: the latest image; Premium: an animation of the last 2 hours with a time slider.
- Cities – your places with their weather; add new ones with +. These cities can also be chosen in the Weather widget.
- Map – your places on a map with the current weather (the tab can be hidden in the settings).
- The dot on Settings in the bottom bar blinks when a newer app version is in the store (the App version card at the top of Settings then has an Update button) and stays steady when a reply to your report is waiting.
Gliding
The Aviation forecast card on the main screen shows ratings for thermal, ridge (slopes nearby) and wave for the coming days. “–” means no conditions or no slopes nearby; wave is computed for all of Europe (5 km grid), in detail for southern Poland and the Alps (2 km).
Your airfield: below the card title tap Choose an airfield. The map and list show about 4900 airfields and landing strips across Europe (OpenAIP data) – blue ones are gliding fields, Polish ones with the name of the aeroclub. The Distance from me slider narrows the view and Search by name finds a field in the whole list. Once chosen, the card, the alert (bell) and the widget use the airfield instead of the main location; Change picks another one, ⓧ goes back to the main location. Your strip is missing? Add a landing strip: the cross in the middle of the runway, a name, the ICAO code (if any) and the kind – you can use it at once, others see it after review.
Airfield photos: as for launch sites – thumbnails in the pin window, ⋮ → Photos in the list, Add photo from the camera or the gallery; others see them after approval.
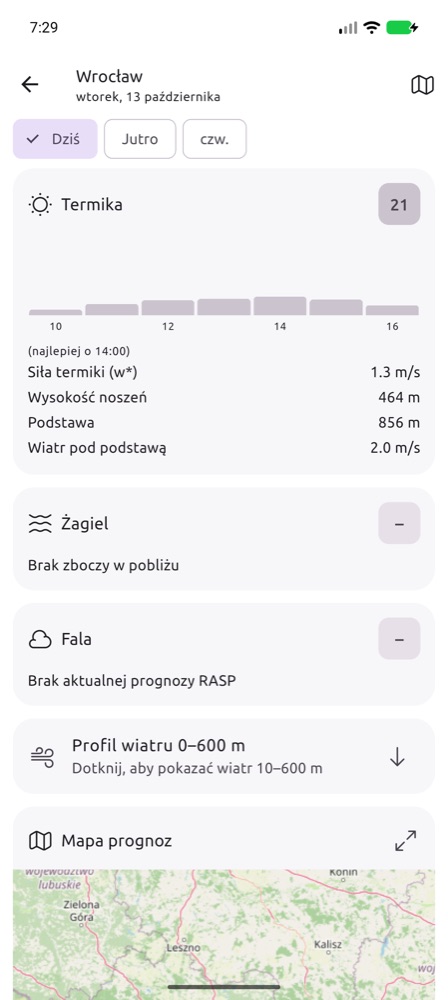
Tap a day or the Day details and forecast map button. On the day screen:
- an hour-by-hour rating chart and the best hour,
- values: thermal strength w*, thermal height, cloud base, wind below cloud base,
- the reasons for the rating (e.g. “Thermals broken by wind”, “Thunderstorm risk”),
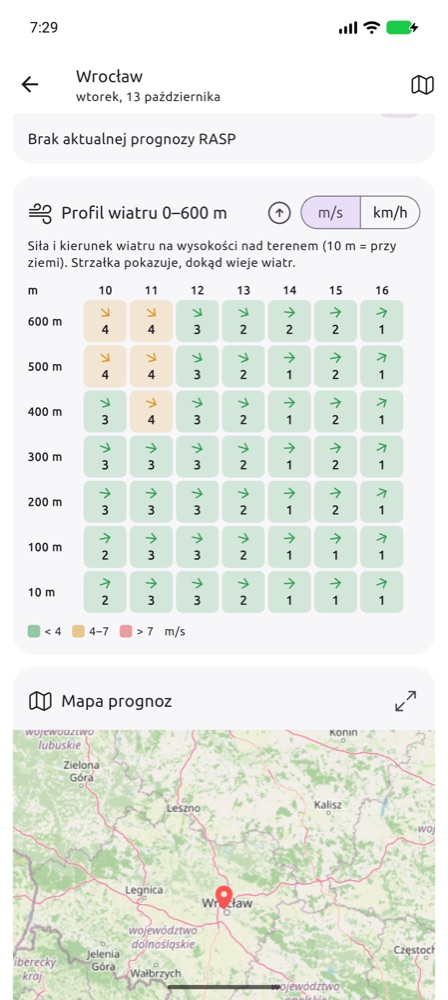
- Wind profile up to the inversion – wind speed and direction every 100 m from the ground to the top of the boundary layer (at least up to 600 m); collapsed, tap to expand,
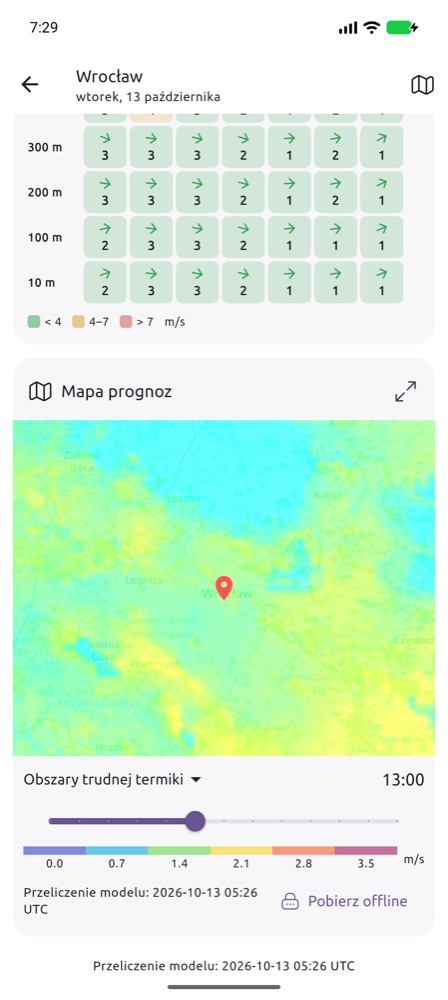
- Forecast map – choose a layer from the list and move the hour slider. The ⤢ icon opens the map full screen, Download offline saves the maps on the phone for flying without internet (Premium). The 💧 icon shows an opacity slider for the forecast layer, so you can see the map underneath.
- Colours on the wave map (layer Wave – levels, wind, clouds): coloured patches are wave lift at the chosen level – the level colour and height are in the legend below the sliders, a stronger colour means strong lift. Grey is cloud with at least 60% cover: low dark grey, mid grey, high light grey diagonal lines (lower cloud shows between them). Blue patches are precipitation, arrows with a number are the wind at the wave level. Change the level, lift thresholds, clouds and precipitation with the sliders button (Wave settings); tapping the map shows the lift at every level, the wind and the low, mid and high cloud cover in %. With Temperature on, the app shows °C at every wave level above the forecast point (or at your position) and the freezing level; tap the map for the temperature elsewhere. The Sink instead of lift option draws the areas where the air sinks (usually behind the lift band, downwind) – with its own sink thresholds.
In-flight map – the ▲ button on the forecast map card (today): the glider at its GPS position on the map, a cross-section of the weather for 20 minutes along the track with the thermal top, and with Premium an artificial horizon. More
Gliding competitions (SoaringSpot)
On the Aviation forecast card tap Competitions (SoaringSpot). You see the contests in progress and upcoming on SoaringSpot; the search finds others by name, country or year (e.g. “2026 Poland”). Choose the contest, the class you fly in and the task – the app remembers the contest and the class.
For the task the app flies a reference glider of your class (e.g. Club – LS4, Standard – LS8, 18 m – JS3, Open – JS1 21 m) on the FCST forecast:
- Start – the best start time, expected finish and average speed, the start window and a strip of all start times (speed, or the distance reached when the task is not finished).
- Route on the map – on an AAT the depth in the areas is chosen to fit the minimum time (deeper where conditions are better); on a racing task the shortest way through the cylinders.
- Legs – cumulus with base or blue, cirrus over the leg, w*, thermal height, tailwind or headwind, time and speed.
- Where to speed up, where to slow down – stretches with kilometres and times: strong Cu (higher MC), weaker lift, no Cu, cirrus damping the thermals, a small working band.
- Warnings – no lift (where an outlanding is likely), showers, overdevelopment and storms, a task too long, a finish after the thermals end.
When there is no forecast for the task day (a past task, or too far ahead), the app offers a simulation – the same task on the forecast of a day you choose. The forecast covers Europe; tasks on other continents are outside it. Today is free, later days are Premium. This is a planning aid for the class reference glider – it does not replace the competition met briefing.
Paragliding
The paragliding rating is computed for a specific launch site: it checks whether the wind blows into the launch, how strong it is at launch and up to 600 m, whether there will be thermals or ridge lift, and the risk of thunderstorms, overdevelopment, turbulence and wind gradient.
- On the Paragliding card tap Choose a launch site. The map and the list show all verified launch sites and your own submissions (orange). The Distance from me slider narrows them to a radius around your position (GPS) or the main location. Tap a pin on the map and the app asks whether to check the weather there; where pins overlap, pick the site from a list first. The star ☆ adds a site to your favourites: favourites always come first on the list whatever the distance (e.g. the Sudetes and the Alps from Wrocław), and on the Paragliding card you switch between them with one tap.
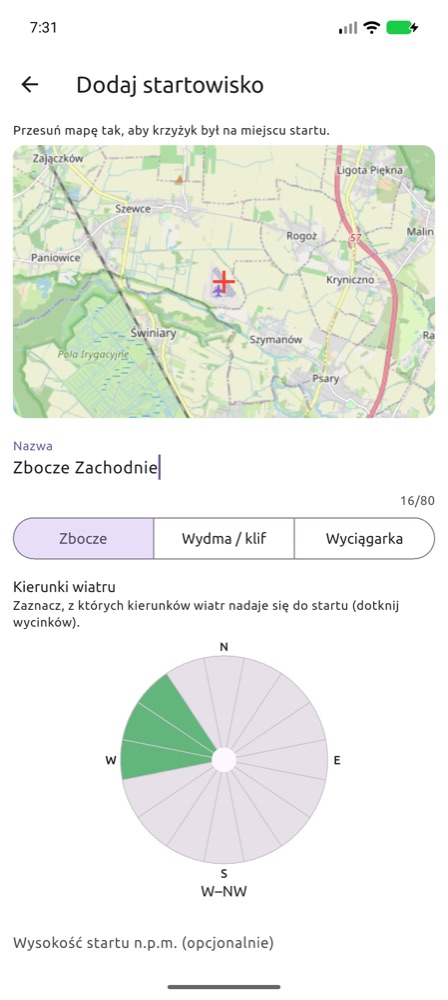
- Your launch site is missing? Add launch site: move the map so the crosshair is on the launch, type a name, choose the type (Slope, Dune / cliff, Winch, Flat (PPG) – flat ground for PPG and PPGG) and tap the sectors of the wind rose the launch works for. Winch and flat sites need no directions – you launch into wind from any side. Elevation and notes are optional. You can also type the position as coordinates in degrees (e.g.
50.7049and16.0123; you can paste50.7049, 16.0123into the first field at once) – the map moves there. The button in the map corner switches to satellite imagery, where the launch is easier to find. - You can use your own submission right away; others will see it after verification. Editing: on the list tap ⋮ → Edit (or Edit in the pin dialog). Your own unverified submission changes at once; a change to a verified site goes to review as a correction and replaces the current data once approved.
- Launch site photos: the pin window shows thumbnails; Photos (n), or ⋮ → Photos in the list, opens the gallery (pinch to zoom, swipe between photos). Add photo – from the camera or the gallery; with your first photo you confirm it is your own and agree to its publication. The app scales the photo down before sending and the server removes all metadata (including the GPS position and the phone model). You see your photo at once (waiting for review), others after the admin has approved it. Best photograph the launch, the landing and the view, without close-ups of people or number plates. Limits: 5 photos a day, up to 12 photos per place. Delete your own photo with the bin icon in the viewer; report an unsuitable photo with the flag icon.
- In the free plan tap Set this location to choose your free launch site.
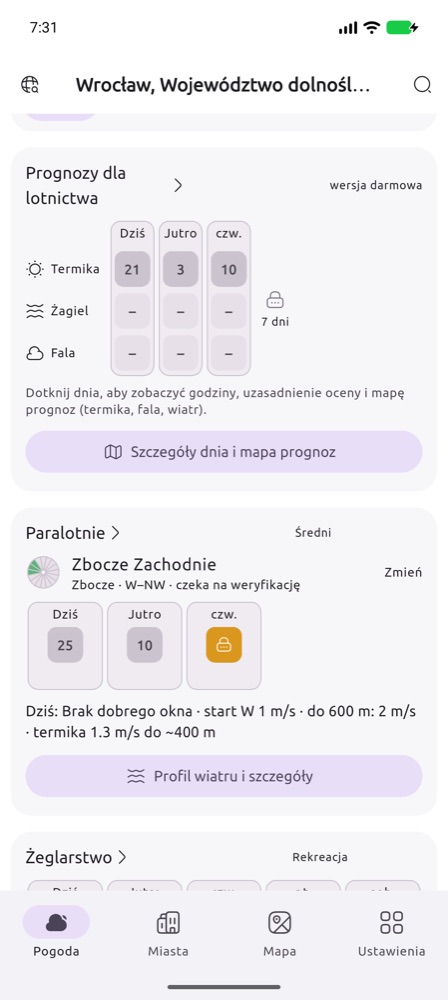
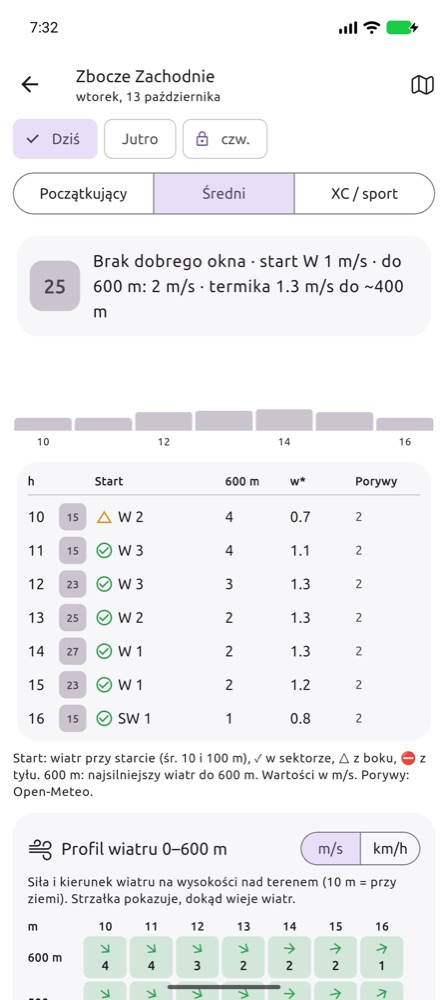
On the day screen:
- Pilot profile – Beginner, Intermediate, XC / sport. It changes the acceptable wind and thermal strength, and so the rating.
- Hourly table – wind at launch (average of 10 and 100 m) with a marker: ✓ within the launch sector, △ crosswind, ⛔ tailwind; the strongest wind up to 600 m; w*; gusts (from Open-Meteo, when the launch site is close to your location). Values in m/s.
- Warnings (thunderstorms, overdevelopment, strong wind aloft, gradient, turbulence) with times – always free.
- Wind profile up to the inversion (every 100 m, at least up to 600 m) with colours matched to the pilot profile, the launch-site description and the forecast map.
- Notify me about good conditions (Premium) – the server checks the launch site after every forecast run and sends a notification when the rating exceeds the threshold you chose.
Airplane (VFR) – My flight
A profile for airplane pilots flying under visual flight rules (VFR). You enter the route, departure time, speed and cruise altitude, and the app shows the weather where you will be, at the time you will be there: cloud base (ceiling), visibility, wind at cruise altitude, freezing level, thunderstorm and icing risk, and the METAR and TAF of the airfields on the way.
- Tick Airplane (VFR) on first launch or in Settings → Disciplines. The My flight card appears on the main screen.
- Tap Plan a flight and enter the route: ICAO airfield codes (foreign ones too) or coordinates in decimal degrees
lat,lon, e.g.51.10,16.88, separated by spaces. 2 to 20 points, at most 2000 km. - Set the departure date and time (local time), TAS (kt), cruise altitude (ft above mean sea level) and your minima: ceiling (ft above ground) and visibility (km).
- Importing a route file: export the plan in SkyDemon, Garmin Pilot or ForeFlight and choose Share → FCST (on iPhone also Open in… → FCST), or tap Import a route file in My flight. Supported files:
.flightplan(SkyDemon),.fpl(Garmin Pilot, ForeFlight) and.gpx. A SkyDemon plan also brings its cruise altitude. SkyDemon stores aerodromes as coordinates only – the departure and destination names come from the file name, and Polish airfields are recognised by position. - Tap Check the route weather. The last plan and its result stay on the phone – the card shows them offline too.
The screenshots show the app in Polish; with English selected in the app the labels are in English.
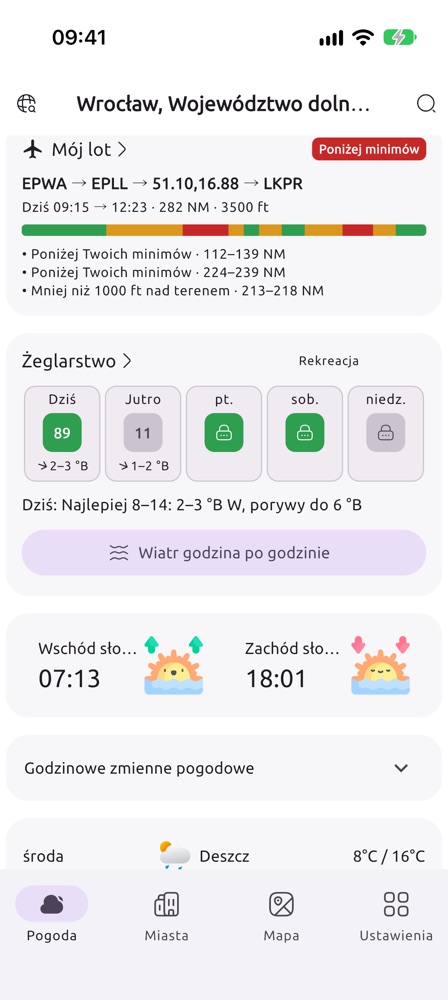
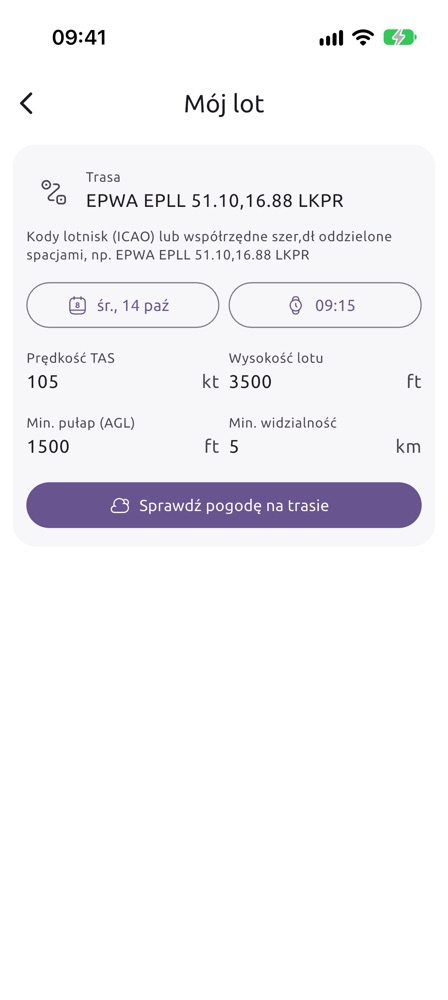
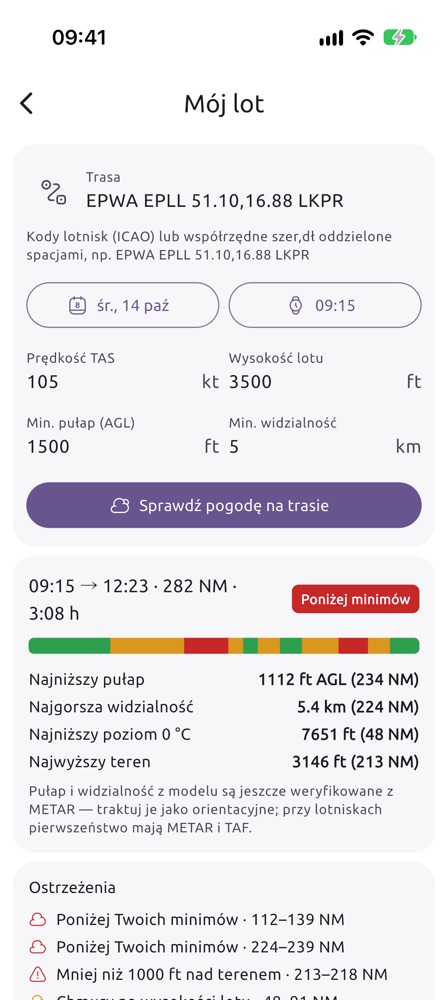
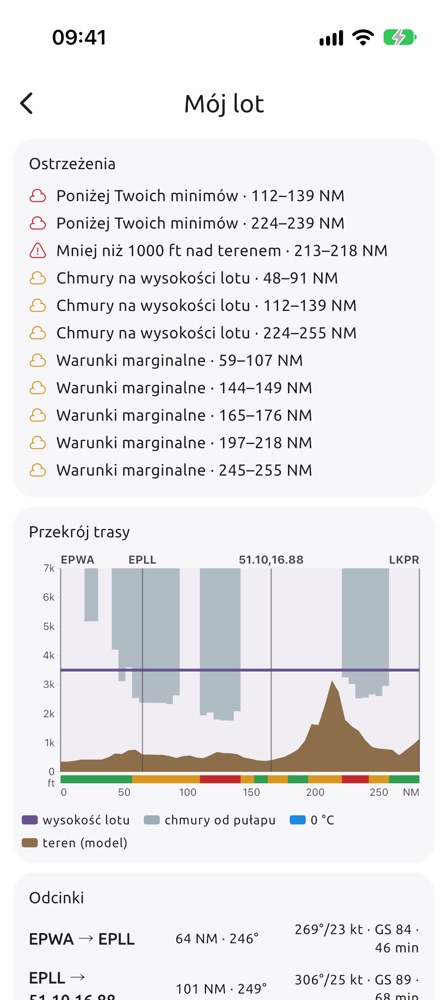
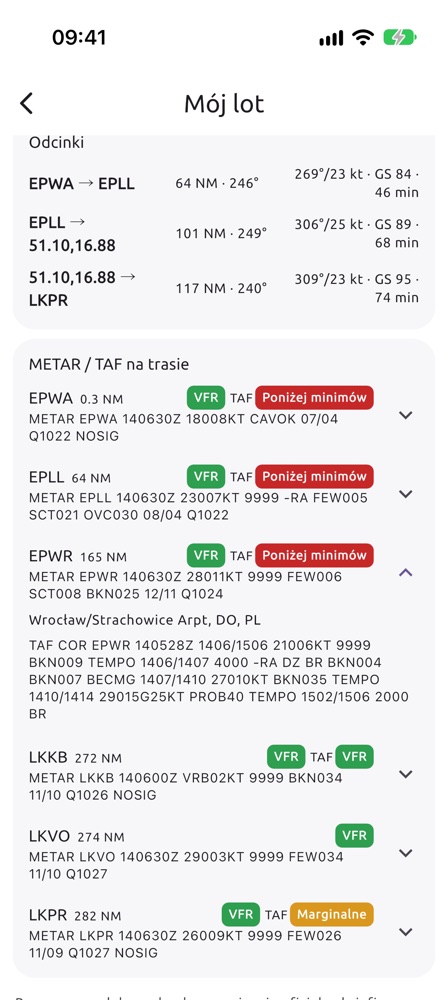
EPWA EPLL 51.10,16.88 LKPR – Warsaw Chopin, Łódź, Wrocław-Strachowice given as coordinates (the app recognises the airfield and shows EPWR), Prague Ruzyně; TAS 105 kt, 3500 ft, minima 1500 ft and 5 km. Result of 14 October (screenshots above): 282 NM, 3:08 h, overall Below minima. The strip and warnings show where: cloud at cruise altitude over central Poland, ceiling below minima at 112–139 NM and 224–239 NM, and less than 1000 ft above terrain at 213–218 NM (Sudetes). Descending is no option over the mountains – on such a day check a later departure or another route.What the result shows:
- Summary – departure and arrival, distance, flight time and the worst category on the route. The strip below is the whole route from departure to destination: VFR ceiling and visibility at least 1000 ft and 3 km above your minima, Marginal above the minima but without that margin, Below minima, grey – no forecast.
- Lowest ceiling (ft above ground), worst visibility, lowest freezing level and highest terrain – with the distance from departure in NM.
- Warnings with route stretches in NM: thunderstorm risk (CAPE from 1000 J/kg, or from 500 J/kg with rain), below your minima, icing risk (0 °C at or below cruise altitude, in cloud or in rain), less than 1000 ft above terrain, cloud at cruise altitude (base less than 500 ft above you or lower), marginal conditions, no forecast.
- Route cross-section – horizontally NM from departure, vertically ft above mean sea level: brown model terrain, grey cloud from the ceiling up, blue rain strokes, dotted grey cumulus base (where the model has low cloud), dashed blue freezing level (when it fits on the chart), orange hatching for possible icing (above the freezing level in cloud or in rain; shows whether a higher or lower altitude stays out of it), purple cruise altitude, vertical lines at the waypoints and the category strip.
- Legs – distance, course, wind at cruise altitude, ground speed (GS) and time. Time comes from the wind at cruise altitude, without climb and descent.
- METAR / TAF along the route – airfields within 25 km of the route, in the order you pass them. The colour next to the METAR is its category against your minima; next to the TAF, the worst period of the whole forecast (including TEMPO and PROB). Tap an airfield for the full TAF. Source: aviationweather.gov.
Suggest a route – below the flight form. The app looks for a route from the first to the last point around airspace (OpenAIP), terrain (at least 1000 ft above it) and bad weather at the cruise altitude. The switch I may enter controlled airspace lets it cross CTR/TMA when you have an ATC clearance. The result shows a map with the route and the direct line, distance and time, the highest terrain, the airspace on the way and notes (ATC clearance, activity of R areas, transponder). Use this route puts the points into the form and computes the route weather at once. When there is no route, the app tells you the lowest altitude at which there is one.
Route and airspace map – in the flight result: the route in weather colours over the OpenAIP airspace. Zones at the cruise altitude are bold, the others faint. Tap the map to see the zones at that point (name, class, limits, frequency); move the map with two fingers or full screen. The airspace has no NOTAM or activity (AUP) – check it with the official sources.
In-flight map – the button under the route map in the flight result (for gliders ▲ on the forecast map card, today only). A full-screen forecast map with your aircraft at its GPS position, the flight trail and the airspace at your present altitude; at the top ground speed, GPS altitude and track. At the bottom the cross-section ahead – the weather for 20 minutes of flight straight along your present track: real terrain, ceiling and cumulus base, the 0 °C level, cloud and rain, for gliders the thermal top; below it lines such as “ceiling 1800 ft in 6 min”. It refreshes every 90 s and after a turn. The screen stays on, and the position is used only while the screen is on. Artificial horizon (Premium): a see-through layer over the map with the horizon line, pitch ladder and bank scale, from the phone’s motion sensors (corrected with the GPS speed in turns). The phone must be fixed in its mount; in straight and level flight tap Zero the horizon and confirm – the present phone position becomes 0°. The horizon is for orientation only, not for flight without visual reference. Altitude comes from GPS, and the whole in-flight map is a weather aid, not navigation.
Airfields METAR / TAF – the second card of the Airplane profile: your list of up to 20 airfields (by default EPWR, EPWA, EPPO, EPKT, EPKK). Add an airfield by its ICAO code and reorder by dragging the handle. Tap an airfield for the decoded METAR and TAF (wind, visibility, clouds, weather); colours follow your minima from “My flight”. The latest reports stay on the phone for offline use. Source: aviationweather.gov (NOAA).
On the free plan the departure must be today, from now up to 3 hours ahead; other days and times come with Premium. Warnings and METAR/TAF are always shown in full.
Sailing
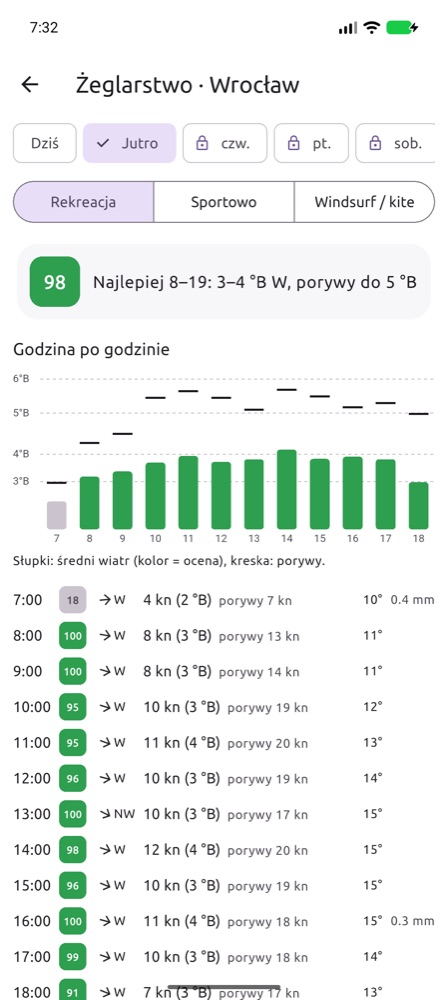
The Sailing card rates the sailing conditions for the coming days and shows the wind on the Beaufort scale. On the details screen choose a profile: Leisure, Sport or Windsurf / kite. You will see the best sailing window, a wind and gust chart and an hourly table (knots, Bft, gusts, temperature, precipitation).
Marina: tap Choose a marina (or Change next to its name). The map and the list show reviewed marinas and your own submissions (orange); the Distance from me slider narrows them. Tap a pin and the app asks whether to check the weather there. Your marina is missing? Add a marina: put the cross in the harbour, enter the name and choose the kind of water. You can use it at once; others see it after review. Until you choose a marina, the scores are for the main location.
Marina photos: thumbnails in the pin window, ⋮ → Photos in the list, Add photo from the camera or the gallery (e.g. the harbour entrance, the pontoons, the slipway); others see them after approval.
Warnings of thunderstorms, squalls and gusts from 8 Bft appear on the card. The data comes from Open-Meteo (wind 10 m above ground) – over open water the wind is usually stronger.
My voyage (card below Sailing): tap the map to draw a route from your marina (tap a point to remove it; GPX import works too). Set the departure time, Sail or Engine and the boat speed in knots – under sail, the speed on a beam reach in about 12 kt; beating, running and calms are worked out for you. You get wind, gusts, waves and current where you will be at that hour, the passage time, warnings (your wind, gust and wave limits, thunderstorm, fog, foul current, darkness, a leg over land) and a comparison of departure times scored 0–100. Area: the Baltic with lagoons and the Masurian lakes, the Adriatic, Central European lakes (no waves or currents on lakes). Weather DWD ICON-EU, sea Copernicus Marine. Free: today, departure within 3 h; Premium: up to 5 days and the departure comparison.
Mountain hiker – My hike
A profile for mountain walkers (turn it on in Settings → Disciplines or at the first start). The main screen gets a My hike card.
- Put points on the map – start, summit, more points (up to 15). The app routes them along the trails and paths of OpenStreetMap and shows the length and the total climb. Back to start closes the loop (e.g. Karpacz → Sněžka → Karpacz), Import GPX reads a route from mapy.cz, Komoot or Garmin. Tap a point to remove it.
- Choose the day, the start time and the pace (easy, normal, fast). Walking time comes from the length, the climbs and the descents – much like trail signposts.
- Check the weather on the route. For every place of the route, at the hour you will be there and at its real height, you get: temperature and wind chill, wind and gusts, humidity, visibility, precipitation, thunderstorm risk, and whether you will be in cloud / fog.
Find a route by name: type From (e.g. Zakopane, Kuźnice) and To (summit, hut, pass, lake) and pick the places from the suggestions. Show routes gives up to four options along the trails – length, climbing, walking time, highest point and difficulty (easy, moderate, difficult, very difficult, climbing) from the OpenStreetMap path data, with the metres of difficult stretches (exposure, chains). Back the same way adds the descent. Tap an option and the route appears on the map. The difficulty is approximate: check the map and the park / mountain rescue messages too.
A day on foot and huts for the night: once From is chosen, the map shows a circle – the range of one day on foot from the start (about 25 km of trail; half of it when coming back the same way). If To lies farther or the shortest option takes more than 9 hours, the destination is still drawn on the map and the app suggests shortening the route or a hut on the way to rest and spend the night (the huts are on the map too). Tap a hut to make it the destination of the first day; plan the rest for the next day. Each suggestion shows its height and the distance to the other point, so a lake in the Tatras is easy to tell from a namesake elsewhere.
Result: the time at the summit and back, the rating of the route (fine / caution / dangerous), the conditions at the highest point, warnings with kilometres (thunderstorm, gale, strong wind, cloud, severe wind chill, icing, snow, rain, darkness), the route profile with the stretches in cloud and a list of points every ~2 km. Coming down after sunset is clearly marked.
Weather: ICON-D2 (2 km) for the next two days, then ICON-EU, moved to the height of each point. Free plan – departure today; hikes on the next days (up to 5) with Premium. This is a forecast for planning: mountain weather changes quickly – check the mountain rescue messages and, in winter, the avalanche bulletin before you go.
Balloon
A profile for hot-air balloon pilots (turn it on in Settings → Disciplines). The main screen gets a Balloon card: choose a launch place (a point on the map, coordinates or your position) to see a 0–100 score of the morning window (launches from half an hour before sunrise to about 2.5 h after it) and the evening window (launches from 3 h to 1 h before sunset) for 5 days.
- Hours of a window: surface wind (10 m) and gusts, strongest wind 100–1000 m, steering (the largest change of the wind direction between heights – the larger, the easier to steer by changing height) and visibility. A launch score counts the landing hour too. It goes down with surface wind (full score up to 3 m/s, zero from 5.5 m/s), gusts, strong wind aloft, thermals, fog and poor visibility, a low cloud base, rain and thunderstorms.
- Tap an hour: wind (direction, m/s, km/h) and temperature at every height. From 8 to 20 the wind comes from FCST – every 100 m up to the inversion; earlier (summer morning flights) and later from Open-Meteo.
- Trajectories: from a launch at the chosen time, for a 30–180 min flight, at constant heights of 100–1500 m above ground. The map shows the tracks of the chosen heights and the landing points of all heights – that is how far you can steer by changing height. The table gives direction, distance, speed and landing time. Move the map with two fingers.
- Warnings: thunderstorms during the day (gust fronts reach tens of kilometres) and the hour the thermals start.
Free plan – today (score and trajectories); later days are Premium. The forecast does not replace a briefing, METAR/TAF and your own assessment on site – the pilot decides about the flight.
Skiing
A profile for skiers (turn it on in Settings → Disciplines). On the Skiing card choose an area – the search knows over 3,000 downhill areas and about 1,100 cross-country centres across Europe (name, town, region) – and the kind: downhill or cross-country.
Areas nearby: the list under the search is sorted by distance. The dot next to an area shows the current modelled snow at mid-height of the area: green – at least 20 cm, orange – less, red – none (the model does not know artificial snow). The Snow (e.g. at least 50 cm) and Runs (e.g. at least 5 km) filters narrow the list, and Sort orders the areas in range by distance, by the most snow or by the most runs.
- Day score 0–100 (lift hours 9–16): sun and fresh snow raise it; strong wind and gusts at the top (lifts often stop from about 70 km/h gusts), fog, snowfall during the day, rain at the base, hard frost, warmth (soft snow) and little snow in the model lower it. Cross-country is scored at the base.
- Three heights: temperature at the base, middle and top, wind at the top, freezing level, fresh snow of the last day and three days, sunshine and the hours – in the area's local time.
- Snow type (powder, fresh, packed, spring, hard/icy, wet) is a hint from temperatures, not a measurement. Models know no artificial snow – the depth is approximate; check open runs on the area's website.
- Avalanche danger: the official level (1–5) of the micro-region from the warning service's bulletin (Austria, Switzerland, Bavaria, South Tyrol, Trentino, Veneto, France, Poland, Slovakia and other EAWS countries, via avalanche.report), by elevation and time of day, with the issuing service and a link to the full bulletin. The app passes the bulletin on – it makes no assessment of its own.
- Ski tour: the link under the resort map opens route planning from the chosen area (points on the map, search or GPX import) with the weather along the way, the terrain slope (stretches of 30° or more – avalanche terrain; from a 90 m terrain model, short steep pitches can be steeper) and the avalanche bulletins of every region on the route.
- Resort map: the button under the weather of the chosen area shows its runs in difficulty colours (green – beginner, blue – easy, red – intermediate, black – difficult, orange dashed – freeride) and its lifts. Tap a run or lift for its name, type, length and vertical. The map is kept on the phone, so it opens on the slope without signal; data from OpenStreetMap – check which runs are open with the resort.
Free plan – today and the avalanche level with the link; later days, avalanche problems with aspects and alerts with Premium. Sources: ski areas OpenSkiMap/OpenStreetMap (ODbL), weather Open-Meteo, bulletins of the EAWS warning services.
Photos from users on the map
On the website the 📷 button in the dock, in the app the photo button under the search field in the Map tab show thumbnails of photos sent by users: launch sites, marinas and airfields, plus “after the flight” photos from the Who is going cards. A filter picks the profile (gliding, paragliding, airplane, sailing, ski); tapping a thumbnail opens the place’s gallery. You add a photo in the app: in the list or map of airfields, launch sites or marinas tap the place → Add photo (shown after the team reviews it), or in the Who is going card → Flown / Sailed / Skied (Premium, at once, for 30 days). Your own photos only; camera data is removed.
Who is going – flying, sailing and skiing together
On the day page of an airfield, launch site, marina, ski area or a town from your places the card Who is going shows who is heading there. Instead of typing you pick a state: I’m going (that day), Join (somebody’s “going” – its author gets a notification), Flying / Sailing / Skiing now (today only) and Flown / Sailed / Skied – with an optional photo everybody sees at once.
- Premium users add entries (a paid store account shows it is a real person); without Premium you see all entries.
- With your first entry you choose a nickname (2–24 characters), visible to everybody; change it in the card’s ⋮ menu.
- Entries vanish by themselves: “going” and “joining” after that day, “now” after 6 hours, “done” with its photo after 30 days. Delete your own in its ⋮ menu.
- At somebody else’s entry: Report (we will check it) or Block author – their entries disappear for you; the blocked list and unblocking are in the card’s ⋮ menu.
The app only shows who is going – decisions about flying, sailing or skiing and safety stay with every participant.
Skydiving
A profile for skydivers (in the app turn it on in Settings → Disciplines, on the website it is the 🪂 button next to the profiles). Register a drop zone: the centre (landing target) on the map, the zone radius and the jump altitude above the ground (the top of the zone, e.g. 4000 m). You can have several zones; the app keeps them on the phone, the website in the browser.
- Score 0–100 for every hour of the day (sunrise to sunset) and the best window: lowered by surface wind and gusts (full score up to about 8 m/s), clouds below the jump altitude, poor visibility and fog, rain, thunderstorms, strong thermals (turbulence under canopy) and a spot outside the zone.
- Hour table: rating, ground wind and gusts, wind at the exit altitude (direction/knots), max exit and visibility. Below the table you see the details of the best hour of the day straight away (highlighted); tap another hour to switch.
- Max exit: the highest altitude the clouds allow – 150 m below the base of the lowest layer with 5/8 or more (or the FCST ceiling). The sky column – a cross-section from the ground to about 1000 m above the jump altitude – shows the cloud layers, the zone altitude, the max exit, the 0 °C level and the opening height.
- Winds aloft from the ground to the exit (every 300–500 m): direction, m/s and knots, temperature and cloud cover at each height; the temperature at the exit altitude.
- Spot (estimate): the exit point on the map with the zone, the jump run (into the wind at the exit altitude), freefall and canopy drift, aircraft ground speed and group separation. It is the classic "hands off" calculation (freefall 55 m/s to opening at 1000 m, canopy 5 m/s) – the jumper or jump master always sets the spot.
Data: Open-Meteo (ICON / ECMWF) all over Europe; over Poland the wind to the inversion every 100 m, cloud base and thermals from FCST. Free plan – today; later days with Premium (on the website after linking with the app by QR code). The forecast does not replace the jump master's decision, a look at the sky or aviation reports (METAR, TAF, NOTAM).
Website: today free, later days with app Premium
On the website today's forecast is open to everyone, no sign-in needed. Tomorrow and later days (also in the hours map, soundings and wave mode) are for FCST app Premium users. Premium is bought in the app only.
- Linking: on the website go to tomorrow (D+) – a QR code appears. In the app open Settings → Link with the website and scan the code or type its 6 characters. After you confirm in the app, the website shows the later days by itself.
- One Premium – up to 3 browsers. The app lists the linked browsers with a “Disconnect” button; on the website the ★ at the bottom shows the link and lets you end it.
- A link expires after 90 days unused or when Premium ends.
Alerts and notifications (Premium)
You set an alert with the bell on a profile card on the main screen. The server checks the forecast after every model update and sends a push notification when the conditions are met – even when the app is closed.
- Gliding – thermals: minimum climb (m/s), thermal height (m AMSL), duration (h) and maximum wind below cloud base; you are notified when all conditions are met at the same time. You can also turn on ridge and wave alerts with a rating threshold of 0–100 (in the Alps from the 2 km forecast for today and tomorrow).
- Paragliding – minimum rating for the chosen launch site.
- Airplane – for an airfield: minimum ceiling (ft above ground), visibility, maximum surface wind, whether rain is acceptable and how long the conditions must last; for the route from My flight: departure window and cruise altitude – you are notified when the whole route is VFR within your minima, with no icing, thunderstorms or cloud at cruise altitude.
- Sailing – wind range (kt), maximum gusts and duration for the chosen marina.
- Skiing – fresh snow at the top of the area (cm in a day) and/or the avalanche danger level of the region – each condition notifies on its own.
For each alert you choose how many days ahead to check (from today only to 5 days) and whether to be told when conditions get worse (a newer forecast withdraws an alert already sent). The same alert comes once per day and place; several alerts at once arrive as one notification. Nothing is sent at night (22–7 phone time) – alerts wait until the morning. All alerts are listed in Settings → Aviation forecast → Good-conditions alerts, together with the Send a test notification button.
Settings and the home-screen widget
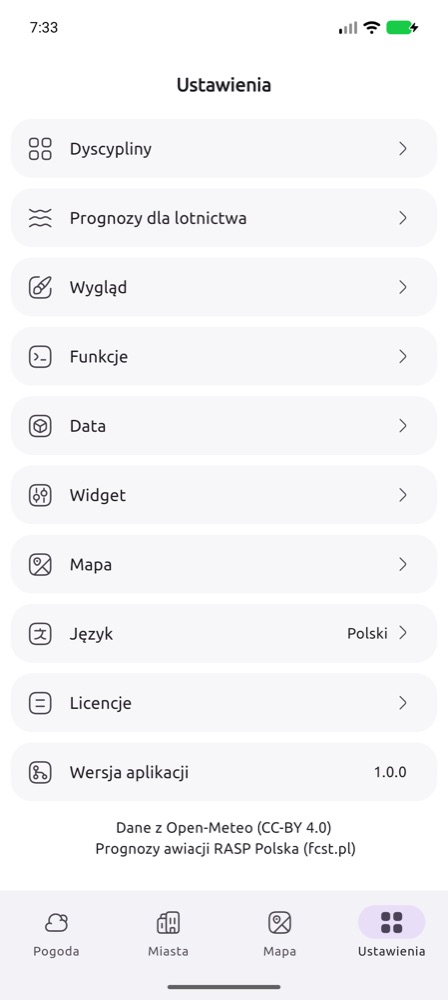
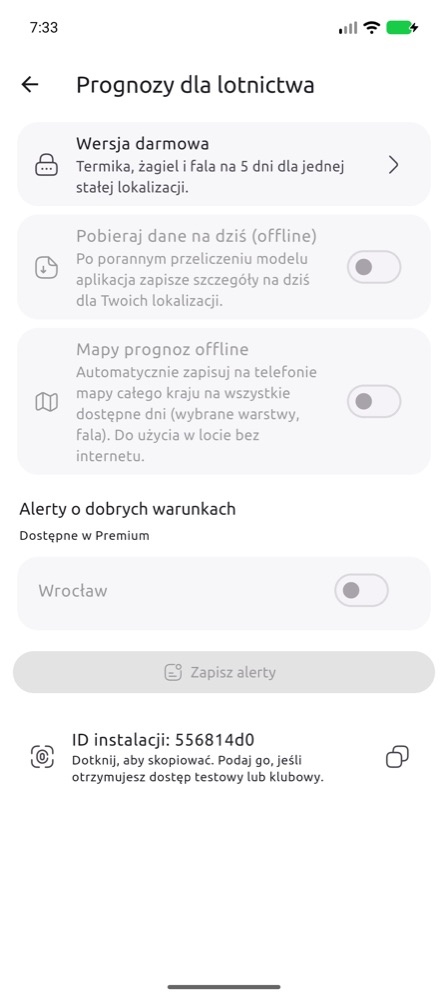
- App version – at the top of Settings: version, update notice and the installation ID (tap to copy). A red “No connection to the FCST server” means the app cannot reach the server (check the internet).
- Premium – plan, free trial, restoring purchases.
- Disciplines – which cards to show on the main screen.
- Aviation forecast – your plan, downloading data and maps for offline use (Premium), good-conditions alerts for saved locations and the Installation ID. Give this ID when you receive test or club access.
- Widget – the widget places and how to add the widgets, also described below.
- Push notifications – turns notifications on this phone on or off, independent of the alerts. Left untouched, they are on while at least one alert is set; when off, the alerts stay saved but do not arrive.
- Send a test notification – checks that notifications reach this phone.
- App version – at the top of Settings: your version and whether a newer one is in the store (Update opens the store).
- Report an idea or a bug – a short form: your idea or what went wrong, up to 3 screenshots or photos (seen only by the FCST team) and an optional e-mail. The app adds its version, the system and the installation ID. Your reports show their status (new, received, done) and the team’s reply – a dot in the bottom bar reminds you of a new reply.
- User ideas – other users’ ideas by profile (gliding, paragliding, VFR, sailing…) and General. An idea is listed after the team reviews it, without the author’s details. Premium accounts have 10 votes a month (one idea may get several, a vote of the current month can be taken back); free accounts can read the list. We consider the most popular ideas for the next releases; each shows its state: planned, in progress, released (with the version) or declined. Votes on released or declined ideas return to your pool.
- Link with the website – later forecast days on polska.fcst.pl in a browser linked to your Premium (details).
- Invite a friend (in the Help section) – sends a link to polska.fcst.pl/mobile.html by text message, messenger or e-mail.
- Language (polski, English, Deutsch, čeština, français, italiano), Appearance and other app settings.
Home-screen widgets
The app has three widgets:
- Weather – for everyone, not only pilots: one place like in popular weather apps. On top 5 day tabs (icon, max/min temperature); tapping a day shows its hours below in 3-hour steps: icon, temperature, rain (mm), wind direction and speed, and gusts. Past hours of today are greyed out. Choose the place from your main location and the cities of the Cities tab (new city: Cities → +). You can add several of these widgets, each for another city. Medium or large; the large one also shows rain and gusts.
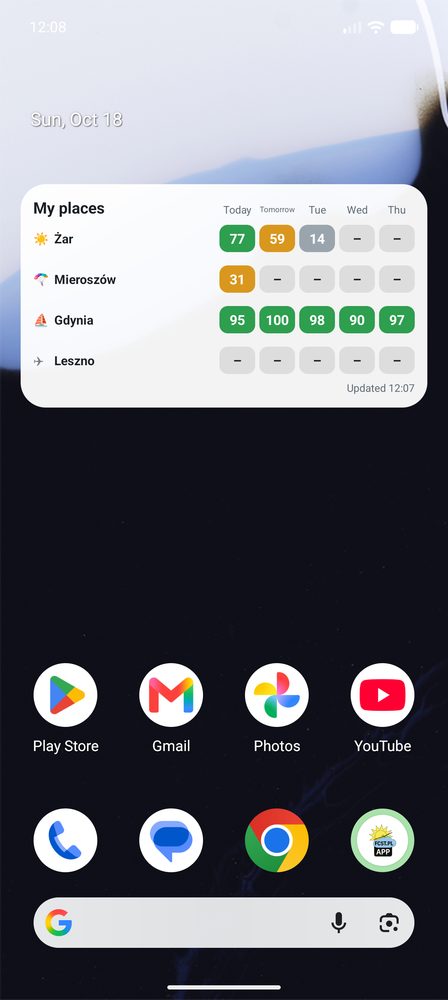
- My places – up to 6 places, each in its own section: the name, below it the weekdays (Mo, Tu, We…) and the forecast rows – thermal, ridge and wave for a gliding airfield, the rating for a paragliding launch site and a marina (a marina also the wind force in Beaufort), VMC hours for a VFR airfield, and temperature, clouds, wind and rain for the weather. On Android you scroll the sections with a finger; on iPhone the widget shows as many sections as fit (medium usually one, large two to four). When you add the widget you choose its profile: All or only Weather, Gliding, Paragliding, Sailing or Airplane – so you can have one widget with the weather and another with your gliding airfields. To change it later: on iPhone hold the widget → Edit Widget, on Android hold the widget → Settings.
- FCST – one place in detail, e.g. thermal, ridge and wave separately, and for a marina also the wind force in Beaufort. You can add several of them, each for another place.
- Weather in the My places and FCST widgets – the plain forecast for a city, day by day: max/min temperature, clouds, wind and rain (mm) for each day. Units as in the app settings.
Which places? In Settings → Widget. At first the list is automatic: the places of the main-screen cards (airfield, launch site, marina) and the weather at your main location. Add place picks from places you already have in the app – main location, your cities (weather), airfield, launch site, marina and alert places; drag to change the order. On the free plan the widget shows only the regular weather in any cities; places with discipline ratings (airfield, launch site, marina) need Premium, up to 6 places of any kind.
iPhone (iOS 17 or later):
- Touch and hold an empty spot on the home screen until the icons jiggle.
- Tap Edit in the top-left corner, then Add Widget (older iOS: +).
- Type FCST in the search field and pick the app.
- Swipe to choose a widget: Weather (medium or large), FCST (small or medium) or My places (medium or large), and tap Add Widget.
- To change the place of a Weather or FCST widget, touch and hold it → Edit Widget → place.
Android:
- Touch and hold an empty spot on the home screen and choose Widgets.
- Find FCST (or search for it), expand it and pick Weather – one place, FCST – one place or My places.
- Tap the preview and Add, or drag it onto the screen. To change the place of a Weather or FCST widget, touch and hold it → Settings (a new Weather widget starts with your main location). A larger My places widget shows more places and days.
Colours: green – good day, yellow – possible, grey – weak, 🔒 – Premium. The widgets update when you open the app and in the background every few hours (on iPhone when the system allows it). Empty widget? Open the app once and check the list in Settings → Widget.
3. Widget for aeroclubs
Aeroclubs can show the FCST forecast for their airfield on their own website for free: thermal, ridge and wave ratings for the coming days, the hour window, thermal strength, cloud base and wind. No registration, no ads, no cookies. The widget updates itself after every model run.
- Set the language, number of days and look – the preview and the code change right away.
- Copy the code and paste it on the club website: in WordPress as a Custom HTML block, in site builders (Wix, Joomla…) as an Embed code / Embed / HTML element.
- If a scroll bar appears in the frame, increase its height.
Rating colours in the widget: ≥ 60 good conditions, 30–59 average, < 30 poor. “no slopes” means there are no slopes for ridge soaring near the airfield, and “out of range” that wave is not computed for this place.
Another airfield – code generator →
4. XCSoar – the FCST forecast in your navigation
Today’s FCST forecast is free in XCSoar – on Android, Windows, Linux, Kobo and navigation devices running XCSoar (e.g. XCTouchNav). The files are in the official XCSoar repository, so you download them inside the program, with no files to copy. The map shows hour by hour: thermal strength (W*), thermal height, cumulus base, cloud cover, rain, surface temperature, boundary layer wind and wave at several heights.
Download the forecast file
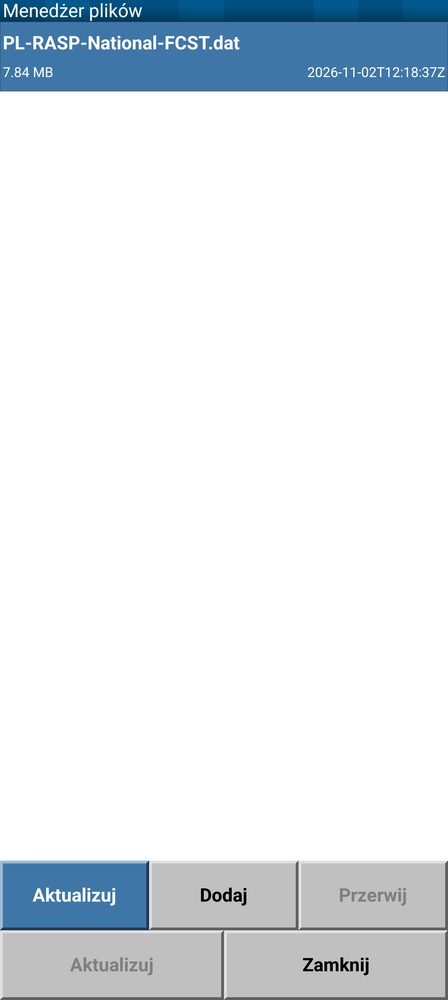
- Open the menu and choose Config → Config Page 2/3 → Data Management → File Manager.
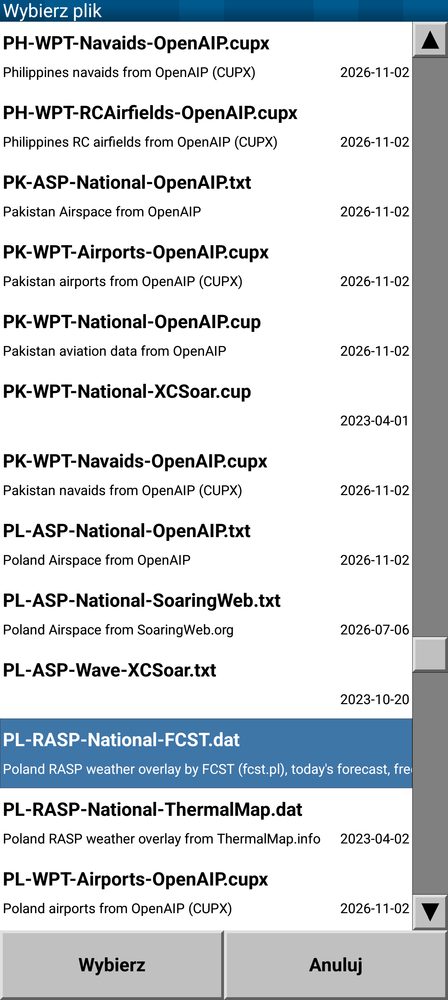
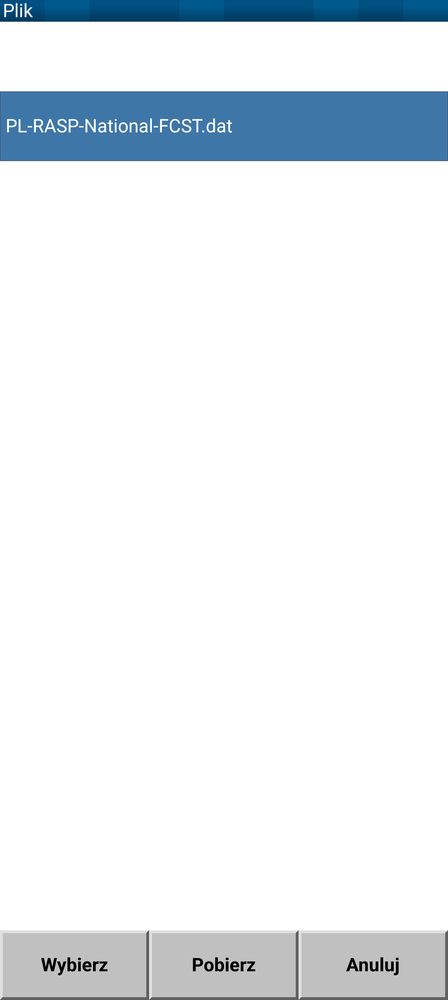
- Tap Add. The list is alphabetical – find the FCST file for your area (table below), e.g.
PL-RASP-National-FCST.dat, and tap Select. - The file downloads over the internet, best over Wi-Fi before the flight. The File Manager shows it with size and date; Update downloads a newer version.
| File | Area |
|---|---|
EU-RASP-Region-FCST.dat | all of Europe (about 17 MB) |
PL-RASP-National-FCST.dat | Poland |
DE-RASP-National-FCST.dat | Germany |
CZ-RASP-Region-FCST.dat | Czechia and Slovakia |
AT-RASP-Region-FCST.dat | Austria and Hungary |
ALPS-RASP-Region-FCST.dat | Alps |
FR-RASP-National-FCST.dat | France |
BE-RASP-Region-FCST.dat | Belgium, Netherlands, Luxembourg |
GB-RASP-National-FCST.dat | England and Wales |
ES-RASP-Region-FCST.dat | Spain and Portugal |
IT-RASP-Region-FCST.dat | Italy and Slovenia |
HR-RASP-Region-FCST.dat | Balkans (Croatia, Serbia, Romania, Bulgaria, Greece) |
DK-RASP-Region-FCST.dat | southern Denmark and the Baltic coast |
Show the layer on the map
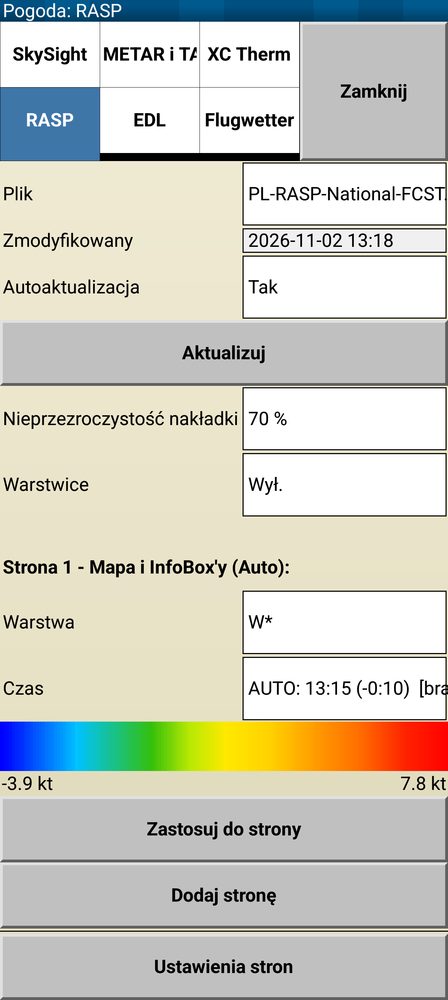
- Menu → Info → Weather → tab RASP.
- File: choose the downloaded FCST file. Auto update: Yes – XCSoar downloads the newer forecast itself when it is online.
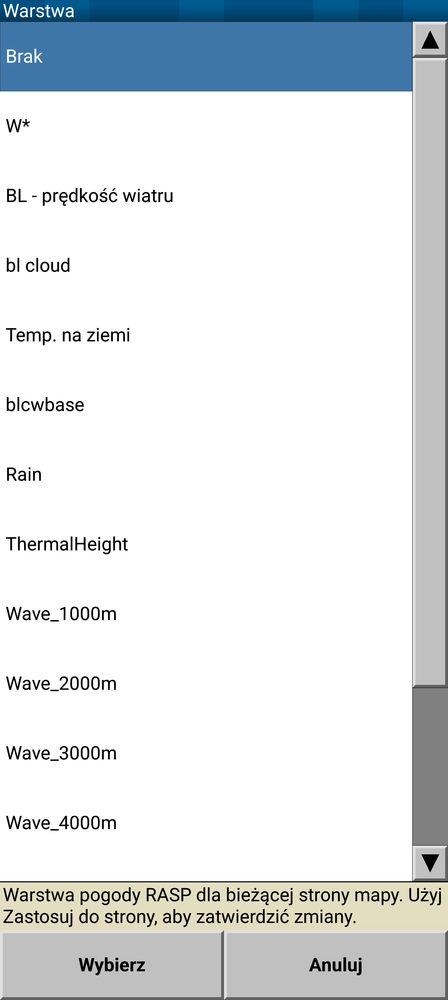
- Layer: e.g. W* (thermal strength), cumulus base or boundary layer wind. Time: AUTO – XCSoar shows the forecast for the current hour and moves on by itself during the flight.
- Tap Apply to page: the layer appears on the map page. Overlay opacity sets how strongly the layer covers the map.
- Tap anywhere on the map: Map elements at this location shows the layer value at that point, e.g. W* +2.2 kt.
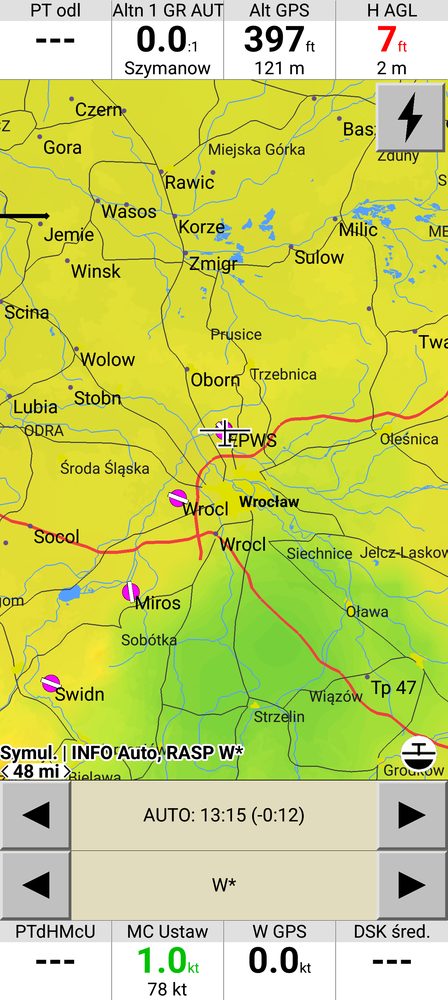
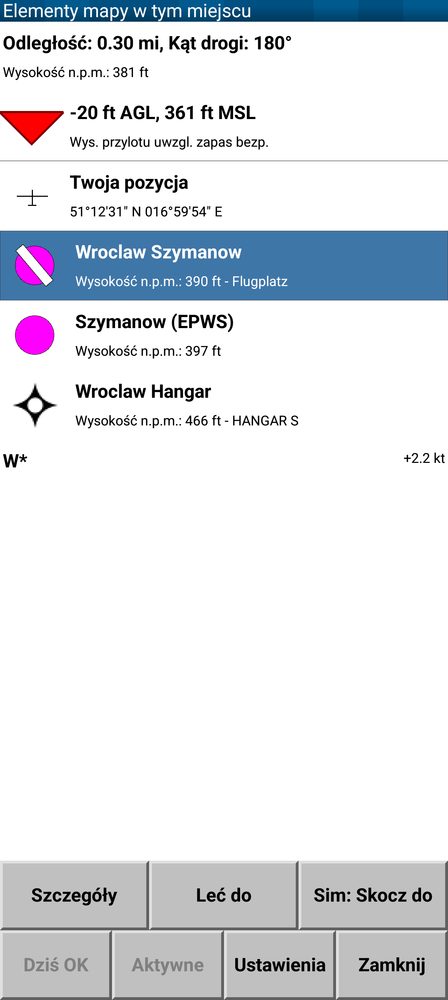
Screenshots of XCSoar 7.45 on Android, with the Polish interface.
5. Questions
- When does a new forecast appear? The model is computed every day; new maps for the coming days appear in the morning (around 6:00–7:30). The run date is shown on the website (🛠️) and in the app below the map.
- How many days ahead? On the website – several days (Day+ button). In the app – the discipline forecasts for today only in the free plan, up to 7 days in Premium (as long as the model already has data for those days). The regular weather forecast always covers 12 days.
- Where do I get the app? From polska.fcst.pl/mobile.html – store links and a QR code to scan with your phone.
- Which area does the forecast cover? Poland and a large part of Europe (about 34–55° N, 11° W–26° E). Wave: all of that European area on a 5 km grid, plus southern Poland in detail (2 km) and the Alps on a 2 km grid (ICON-D2, today and tomorrow). Chile: a separate region (🌍 button), WRF 1.8 km over the Andes, today + 2 days.
- Which time zone are the hours in? Local Polish time (Europe/Warsaw, CET/CEST).
- Maps do not load in the app without internet. Offline maps have to be downloaded beforehand (Premium): the Download offline button below the map or automatic download in Settings → Aviation forecast.
- My airfield is not in the widget generator. Write to support@agg-systems.eu – give the name and coordinates.
- Privacy. Details in the privacy policy.